‘I guess we are from very different backgrounds’:
Educational Mobility and Attitudes Towards Social Justice in European Societies
Hi!
This is a summary of the paper “Attitudes towards Social Justice and Intergenerational Educational Mobility in European Societies” published by Social Indicators Research in 2024.
A pre-print version is available at https://osf.io/preprints/socarxiv/9j7d4
You can reproduce the analyses described here with the data and code available at this repository.
1 What is this research about?
The book ‘Normal People’ by Sally Rooney (2018) offers a literary portrayal of a social phenomenon addressed in this study. Connell, one of the main characters, comes from a working-class family in the country side and is admitted to study in a prestigious university in the capital. The story develops around his relationship with Marianne, who is also studying at the same university and is from a wealthy background with her mother being the employer of Connell’s mother. In a passage of the book, they are having a coffee after receiving the news that both of them got a scholarship, but one of Marianne’s friend did not get it.

Marianne said she was worried about Peggy, who was the only one of the three of them not to get the scholarship. She said it would be hard on her.
Connell inhaled and said nothing. Peggy didn’t need subsidised tuition or free on-campus accommodation, because she lived at home in Blackrock and her parents were both doctors, but Marianne was intent on seeing the scholarships as a matter of personal feeling rather than economic fact. Anyway, I’m happy for you, Marianne said.
I’m happy for you too.
But you deserve it more.
He looked up at her. He wiped his mouth with the napkin. You mean in terms of the financial stuff? he said.
Oh, she replied. Well, I meant that you’re a better student. She looked down critically at her croissant. He watched her. Though in terms of financial circumstances too, obviously, she said. I mean, it’s kind of ridiculous they don’t means-test these things. I guess we’re from very different backgrounds, class-wise.
The theme of a relationship across different social classes is surely not new. But this story in particular unveils subtleties about two individuals who had similar formal education but whose parents had different educational and social experiences and how this affects their views of society, what is fair and what is just.
Inequality and social justice are pressing topics for academics and policy makers in the first quarter of this century. From one side, a solid research agenda has been assessing the rising in social inequalities and its consequences (Savage, 2021). On the other side, a global development policy agenda has been established with a strong focus on these topics (Fukuda-Parr, 2019). However, there is still a lack of evidence on both sides about how individuals perceive and view social justice and what are the factors that influence those views (Benson et al., 2021), despite several studies observing relevant social and political consequences of social justice and inequality attitudes Adriaans (2023). Despite a relatively recent research agenda on factors associated with welfare attitudes (Oorschot et al., 2022), income inequality (Clark & D’Ambrosio, 2015) and social justice attitudes (Adriaans & Fourré, 2022; Reyes & Gasparini, 2022; Steele & Breznau, 2019), there is still insufficient evidence on the determinants of such attitudes, especially the role of educational mobility.
In this work, we contribute to expanding this literature by investigating the relationship between attitudes towards social justice and educational mobility. Two main aspects are important in this endeavour. First, the focus on mobility which provides a more complex understanding of the influence of social stratification by assessing social positions not only within but also across generations. Secondly, this approach also emphasises education as a social process that goes beyond human capital acquisition, shaping perceptions and normative attitudes in relation to social matters. In this sense, intergenerational mobility in educational attainment translates not only into a change in material conditions (i.e. occupation, income) but also in the way individuals view social justice.
With this intent, we investigated the relationship between intergenerational educational mobility and attitudes towards social justice aiming to respond the following main question: Does the experience of educational mobility predict attitudes towards principles of social justice?

2 How was the research conducted?
2.1 Data
The analysis is based on the rotating module of the European Social Survey Round 9 on justice and fairness. The European Social Survey (ESS) is a biennial cross-national survey of attitudes and employs cross-sectional, probability samples that are representative of the population aged 15 and above living in private households in each country. The analytical sample of this study includes data from all the 29 participating countries and excludes observations from respondents who were still in formal education age (24 or younger) resulting in a sample of 44,583.

The theoretical framework underlying the outcome variables emphasises the importance of investigating individuals’ normative orientations in relation to how society should be organised in order to explain objective conditions of inequality and social justice (Hadler, 2005). Following this principle, Hülle et al. (2018) propose a quantitative assessment of individuals’ normative orientations in relation to social justice. The Basic Social Justice Orientations (BSJO) scale include questions validated originally using social surveys in Germany but that have also been tested in different European contexts (Adriaans, 2023; Van Hootegem et al., 2021).
The questions designed by Hülle et al. (2018) aimed at assessing the following four principles of social justice: Equality, Equity, Need, and Entitlement. The exact wording of the statements and their respective associated principle are shown in Table 1.
| Principle | Variable | Wording |
|---|---|---|
| Equality | sofrdst | A society is fair when income and wealth are equally distributed among all people |
| Equity | sofrwrk | A society is fair when hard-working people earn more than others |
| Need | sofrpr | A society is fair when it takes care of those who are poor and in need regardless of what they give back to society |
| Entitlement | sofrprv | A society is fair when people from families with social status enjoy privileges in their lives between |
The responses were recorded through a 5-point agreement scale with the following options: “Agree strongly”, “Agree”, “Neither agree nor disagree”, “Disagree”, and “Disagree strongly”. The original scale was inverted so higher values denote higher level of agreement, ranging from 1 to 5.
2.2 Explanatory variable (education)
The measurement of educational attainment level in the European Social Survey is based on the International Standard Classification of Education (ISCED) (UNESCO Institute for Statistics, 2012). Following a harmonization work conducted by the ESS (Schneider, 2020), we utilised the following levels to measure educational attainment variable: (1) less than lower secondary; (2) lower secondary; (3) lower tier upper secondary; (4) upper tier upper secondary; (5) advanced vocational, sub-degree; (6) lower tertiary education, BA level; and (7) higher tertiary education, >= MA level.
This variable is utilised as it is in the analysis of the pooled sample of all countries together. However, due to the relatively small sample sizes found within countries, these categories were collapsed to allow for enough observations in each cell of the mobility tables. For the analysis comparing different countries, the educational attainment is measured in the following categories: (L1) lower than secondary; (L2) secondary; and (L3) tertiary. The Figure 1 below shows the flows between origin (parental education) and destination (respondent’s education).
2.3 Covariates
The analysis also takes into consideration a group of covariates such as age, gender and feeling about household income.
Table 1 below shows the mean values and standard error od the mean for outcome variable by covariates. As alluded in the section describing the explanatory variables, the three levels shown in Table 1 were used only for the analysis by country. The initial analysis with the pooled sample of all countries used the original 7-level scale (eisced).
| Equality | Equity | Need | Entitlement | |||||
|---|---|---|---|---|---|---|---|---|
| Mean | Std. Error | Mean | Std. Error | Mean | Std. Error | Mean | Std. Error | |
| Educ. attainment (Resp.) | ||||||||
| L1 | 3.67 | (0.01) | 3.92 | (0.01) | 3.88 | (0.01) | 2.20 | (0.01) |
| L2 | 3.51 | (0.01) | 4.01 | (0.01) | 3.89 | (0.01) | 2.13 | (0.01) |
| L3 | 3.08 | (0.01) | 3.94 | (0.01) | 3.92 | (0.01) | 2.09 | (0.01) |
| Educ. attainment (Parent.) | ||||||||
| L1 | 3.58 | (0.01) | 3.96 | (0.01) | 3.87 | (0.01) | 2.12 | (0.01) |
| L2 | 3.34 | (0.01) | 3.99 | (0.01) | 3.90 | (0.01) | 2.15 | (0.01) |
| L3 | 3.07 | (0.01) | 3.95 | (0.01) | 3.94 | (0.01) | 2.14 | (0.01) |
| Mobility direction | ||||||||
| Downward | 3.36 | (0.02) | 3.99 | (0.01) | 3.91 | (0.01) | 2.30 | (0.02) |
| Nonmobile | 3.41 | (0.01) | 3.95 | (0.01) | 3.90 | (0.01) | 2.14 | (0.01) |
| Upward | 3.39 | (0.01) | 3.98 | (0.01) | 3.89 | (0.01) | 2.08 | (0.01) |
| Age group | ||||||||
| 25-44 | 3.33 | (0.01) | 3.95 | (0.01) | 3.86 | (0.01) | 2.17 | (0.01) |
| 45-64 | 3.39 | (0.01) | 3.97 | (0.01) | 3.91 | (0.01) | 2.10 | (0.01) |
| 65+ | 3.48 | (0.01) | 3.99 | (0.01) | 3.92 | (0.01) | 2.13 | (0.01) |
| Gender | ||||||||
| Female | 3.44 | (0.01) | 3.93 | (0.01) | 3.89 | (0.01) | 2.14 | (0.01) |
| Male | 3.35 | (0.01) | 4.00 | (0.01) | 3.90 | (0.01) | 2.13 | (0.01) |
| Feeling about income | ||||||||
| Very difficult | 3.80 | (0.02) | 3.95 | (0.02) | 4.02 | (0.02) | 2.12 | (0.02) |
| Difficult | 3.72 | (0.01) | 3.94 | (0.01) | 3.91 | (0.01) | 2.09 | (0.01) |
| Coping | 3.46 | (0.01) | 3.96 | (0.01) | 3.85 | (0.01) | 2.15 | (0.01) |
| Living comfortably | 3.08 | (0.01) | 3.98 | (0.01) | 3.93 | (0.01) | 2.13 | (0.01) |
| Full sample | 3.40 | (0.01) | 3.96 | (0) | 3.89 | (0) | 2.13 | (0) |
| Source: European Social Survey (Round 9) | ||||||||
2.4 Analytical approach
Educational mobility is a dynamic process that involves both origin status (i.e. parental education) and a destination status (i.e. one’s own education), which cannot be considered independently.
In this analysis, we adopted a new method called Mobility Contrast Model (MCM) recently developed by Luo (2022). This method allowed us to estimate the effect of intergenerational mobility independent from the educational attainment, also considering heterogeneous effects of mobility, which can result from the direction (upward or downward) or range of the mobility (number of levels between origin and destination).
3 What are the results?
3.1 Mobility effects (all countries)
Table 2 shows the mobility effects for all outcome variables by mobility status. The results differ considerably depending on the outcome variable.
The analysis provides evidence that intergenerational educational mobility is associated with the principle of Equality. The strongest relationship is found among those who finished the Level 6 and whose parents completed either the lowest educational level (= 0.226, p <.01), or the second lowest level (= 0.224, p <.05). These are individuals experiencing a notably high level of upward intergenerational educational mobility. The observed increase in the effect size (from L5 to L6) also suggests that greater upward mobility results in increasing support for the principle of Equality. No significant downward mobility effects were detected in the model.
| Parental educ. level |
Respondents' educational level | ||||||
|---|---|---|---|---|---|---|---|
| L1 | L2 | L3 | L4 | L5 | L6 | L7 | |
| Equality | |||||||
| L1 | – | -0.014 | 0.03 | 0.163 | 0.223* | 0.224* | 0.026 |
| L2 | -0.052 | – | 0.108 | 0.079 | 0.168* | 0.226** | 0.147 |
| L3 | -0.126 | -0.024 | – | 0.005 | -0.057 | -0.139 | -0.022 |
| L4 | -0.127 | -0.068 | 0.028 | – | -0.095 | -0.064 | -0.008 |
| L5 | 0.265 | 0.208 | -0.045 | -0.084 | – | -0.102 | 0.052 |
| L6 | 0.12 | 0.089 | -0.045 | -0.064 | -0.121 | – | -0.107 |
| L7 | 0.009 | -0.103 | 0.011 | -0.011 | -0.031 | -0.058 | – |
| Equity | |||||||
| L1 | – | -0.145 | -0.142 | -0.218* | -0.165 | -0.132 | -0.133 |
| L2 | -0.117 | – | 0.005 | 0.072 | 0.101 | 0.042 | 0.036 |
| L3 | 0.012 | 0.026 | – | -0.04 | 0.051 | 0.02 | -0.068 |
| L4 | 0.133 | -0.081 | -0.031 | – | -0.035 | -0.013 | 0.077 |
| L5 | -0.121 | -0.024 | 0.037 | 0.168** | – | -0.035 | 0.002 |
| L6 | 0.082 | 0.087 | 0.078 | -0.033 | -0.022 | – | 0.021 |
| L7 | -0.053 | 0.072 | -0.012 | -0.013 | 0.005 | 0.053 | – |
| Need | |||||||
| L1 | – | -0.014 | -0.076 | 0.006 | -0.051 | -0.015 | -0.114 |
| L2 | -0.253 | – | -0.055 | 0.004 | 0.005 | 0.003 | 0.003 |
| L3 | 0.118 | -0.08 | – | -0.051 | 0.014 | -0.028 | 0.028 |
| L4 | -0.128 | 0.021 | -0.004 | – | 0.047 | -0.023 | 0.001 |
| L5 | 0.032 | 0.19* | 0.039 | 0.087 | – | 0.034 | 0.089 |
| L6 | 0.147 | 0.002 | -0.115 | -0.099 | 0.106 | – | -0.01 |
| L7 | 0.081 | -0.122 | 0.208** | 0.05 | -0.124 | 0.027 | – |
| Entitlement | |||||||
| L1 | – | 0.025 | 0.109 | 0.03 | 0.111 | 0.185 | 0.104 |
| L2 | -0.077 | – | 0.001 | -0.09 | 0.032 | 0.049 | -0.022 |
| L3 | 0.172 | -0.001 | – | -0.099 | -0.068 | -0.029 | -0.079 |
| L4 | 0.016 | 0.034 | 0.061 | – | 0.02 | -0.051 | 0.118* |
| L5 | 0.015 | 0.04 | 0.116 | 0.155 | – | -0.002 | 0.081 |
| L6 | 0.231 | -0.015 | -0.118 | -0.048 | -0.032 | – | -0.151* |
| L7 | -0.306 | -0.032 | -0.117 | 0.103 | -0.01 | -0.1 | – |
| Source: European Social Survey (Round 9) Notes: *p < .05, **p< .01, ***p < .001 |
|||||||
3.2 Mobility effects (by country)
The samples from 7 countries out of the 29 participating countries did not indicate any statistically significant mobility effect: Estonia, Finland, United Kingdom, Ireland, Netherlands, Norway, and Poland. Figure 2 below shows the coefficients of the mobility effects for all the remaining countries.
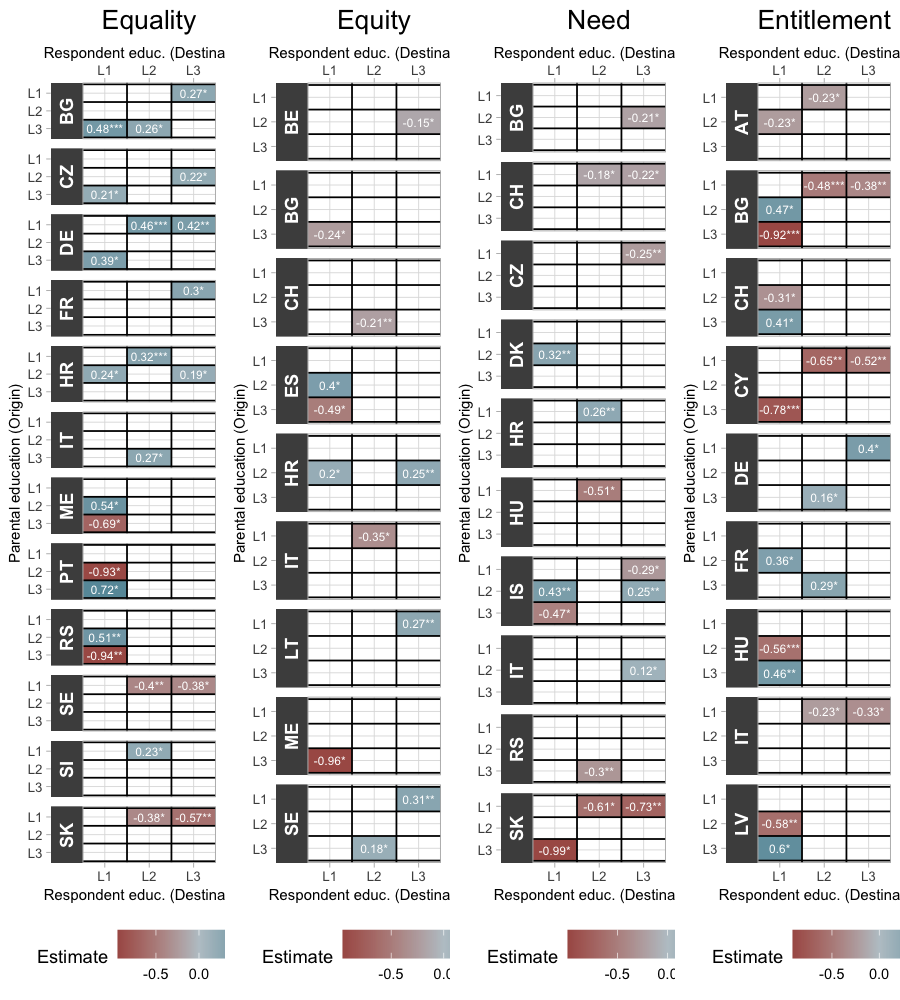
The within-country models depicted in Figure 2 indicate that a pattern similar to that observed for the pooled models (Table 2) can be observed in France (FR) or Germany (DE), where maximum upward mobility (i.e., Level 1 to Level 3) is associated with an additional 0.3 and 0.4 units in the scale of Equality respectively (p<0.05 and p<0.01). However, not all countries match the general pattern in Europe. In two cases, Sweden (SE) and Slovakia (SK), upward mobility from Level 1 to Level 2 or Level 3, is associated with lower support for Equality. This suggests a notable country-level difference in relation to the effects of mobility on support for Equality that would be unobserved in the pooled model with country fixed effects. Finally, the Croatian (HR) case in this model presents evidence on the qualitative differences between mobility groups. Significant effects were found only for groups with one-step mobility – downward and upward – whereas no significant relationship was found across groups with greater intergenerational mobility (i.e., a change in two levels).
4 References
Adriaans, J. (2023). Fairness of earnings in Europe: The consequences of unfair under- and overreward for life satisfaction. European Sociological Review, 39(1), 118–131. https://doi.org/10.1093/esr/jcac044
Adriaans, J., & Fourré, M. (2022). Basic social justice orientations—measuring order-related justice in the European Social Survey Round 9. Measurement Instruments for the Social Sciences, 4(1), 11. https://doi.org/10.1186/s42409-022-00040-3
Benson, R., Duffy, B., Hesketh, R., & Hewlett, K. (2021). Attitudes to inequalities: The IFS deaton review. https://ifs.org.uk/inequality/wp-content/uploads/2021/09/Attitudes-to-inequalities.pdf
Castillo, J. C., Palacios, D., Joignant, A., & Tham, M. (2015). Inequality, Distributive Justice and Political Participation: An Analysis of the Case of Chile. Bulletin of Latin American Research, 34(4), 486–502. https://doi.org/10.1111/blar.12369
Clark, A. E., & D’Ambrosio, C. (2015). Attitudes to Income Inequality. In Handbook of Income Distribution (Vol. 2, pp. 1147–1208). Elsevier. https://doi.org/10.1016/B978-0-444-59428-0.00014-X
Fukuda-Parr, S. (2019). Keeping Out Extreme Inequality from the SDG Agenda – The Politics of Indicators. Global Policy, 10(S1), 61–69. https://doi.org/10.1111/1758-5899.12602
Hadler, M. (2005). Why Do People Accept Different Income Ratios?: A Multi-level Comparison of Thirty Countries. Acta Sociologica, 48(2), 131–154. https://doi.org/10.1177/0001699305053768
Hülle, S., Liebig, S., & May, M. J. (2018). Measuring Attitudes Toward Distributive Justice: The Basic Social Justice Orientations Scale. Social Indicators Research, 136(2), 663–692. https://doi.org/10.1007/s11205-017-1580-x
Jo, J.-I., & Choi, H. J. (2019). Enigmas of grievances about inequality: Effects of attitudes toward inequality and government redistribution on protest participation. International Area Studies Review, 22(4), 348–368. https://doi.org/10.1177/2233865919833973
Lei, Y.-W. (2020). Revisiting China’s Social Volcano: Attitudes toward Inequality and Political Trust in China. Socius, 6, 2378023120915382. https://doi.org/10.1177/2378023120915382
Luo, L. (2022). Heterogeneous Effects of Intergenerational Social Mobility: An Improved Method and New Evidence. American Sociological Review, 87(1), 143–173. https://doi.org/10.1177/00031224211052028
Oorschot, W. van, Laenen, T., Roosma, F., & Meuleman, B. (2022). Recent advances in understanding welfare attitudes in Europe. In Social Policy in Changing European Societies (pp. 202–217). Edward Elgar Publishing. https://www.elgaronline.com/display/book/9781802201710/book-part-9781802201710-21.xml
Reyes, G., & Gasparini, L. (2022). Are fairness perceptions shaped by income inequality? Evidence from Latin America. The Journal of Economic Inequality, 20(4), 893–913. https://doi.org/10.1007/s10888-022-09526-w
Rooney, S. (2018). Normal people. Faber & Faber.
Savage, M. (2021). The return of inequality: Social change and the weight of the past. Harvard University Press.
Schneider, S. L. (2020). Guidelines for the measurement of educational attainment in the European Social Survey. GESIS. https://www.europeansocialsurvey.org/docs/methodology/ESS_guidelines_for_the_measurement_of_educational_attainment_ed2.pdf
Steele, L. G., & Breznau, N. (2019). Attitudes toward Redistributive Policy: An Introduction. Societies, 9(3), 50. https://doi.org/10.3390/soc9030050
UNESCO Institute for Statistics. (2012). International standard classification of education: ISCED 2011. UNESCO Institute for Statistics. http://www.uis.unesco.org/Education/Documents/isced-2011-en.pdf
Van Hootegem, A., Meuleman, B., & Abts, K. (2021). Measuring public support for distributive justice principles: Assessing the measurement quality of the Basic Social Justice Orientations scale. International Journal of Public Opinion Research, 33(4), 986–997. https://doi.org/10.1093/ijpor/edaa041